We would like to measure performance of our CM6-based editor. We are tracing an “input lag” issue and would like to know how widespread this is.
We think a useful metric would be to measure the time between the user’s keystroke and that character appearing on screen, or some rough approximation of those events.
We have prototyped a few different ideas, like watching for DOM changes via a MutationObserver or patching dispatch but have not found a satisfying solution. In particular we have struggled to detect when a character has been rendered, as opposed to other DOM changes.
Are there any known solutions or approaches to measuring this kind of performance with CM6? I can share the ideas that we have prototyped if wanted.
You can often get a general idea of this by carefully looking at the profile flame graphs and looking for draw events, but I am also not away of an automated way to get measurements like this.
(Also, when profiling CodeMirror with a language parser active, sure you also measure with a warmed up compilation cache, as the parser is a lot faster when optimized.)
Thanks for the reply! We have been using flamegraphs to investigate the problem “in the lab”, but we’ve struggled to reproduce the issue on our dev machines. Hence why I’m interested in measuring the problem “in the field”.
looking for draw events
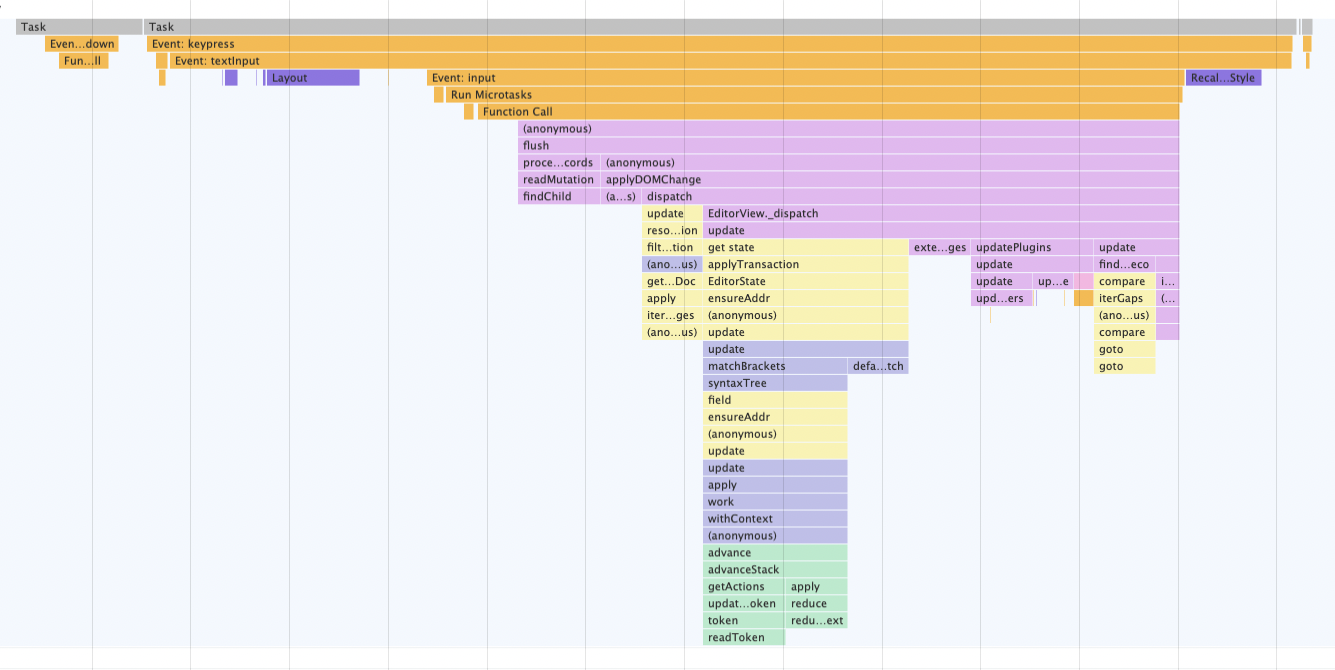
Could I ask for clarification on what you mean by this? Are you referring to this part of the flamegraph?
At least in Firefox, you get ‘paint’ events in the flame graph, which I use to figure out where the DOM has been drawn to the screen so that the user can see it.
Wrapping dispatch will only measure the time it takes to do the state update and DOM write. Further DOM measuring will happen in an animation frame request, and DOM painting will also happen after dispatch returns. Still, depending on what you want to measure, this might cover the bulk of the JS work.
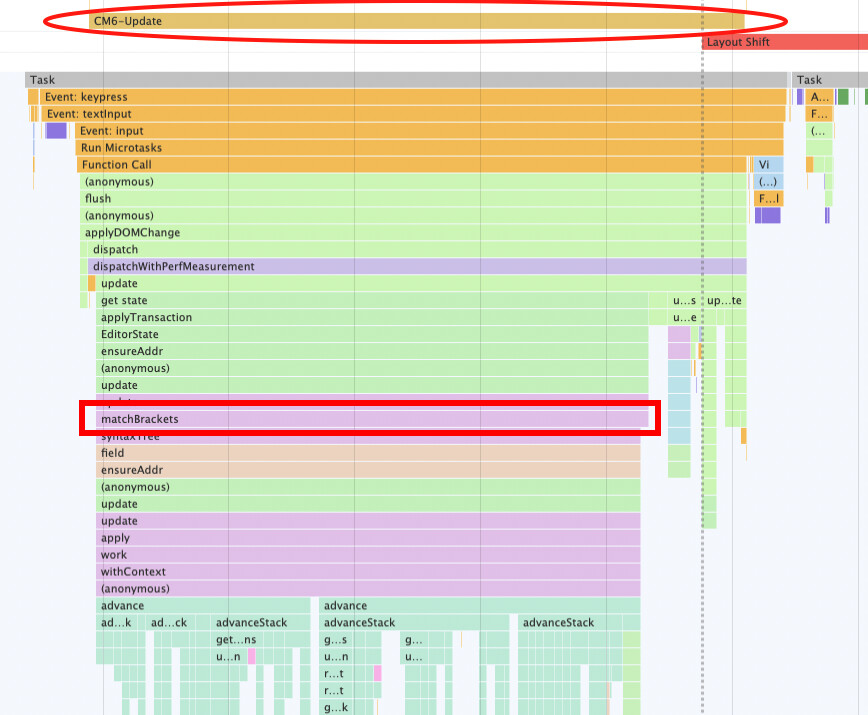
No, that’s not correct. matchBrackets is just the first thing that queries the syntax tree, forcing the parser. If it doesn’t do that, something else will.